Step 3: Measuring group velocities
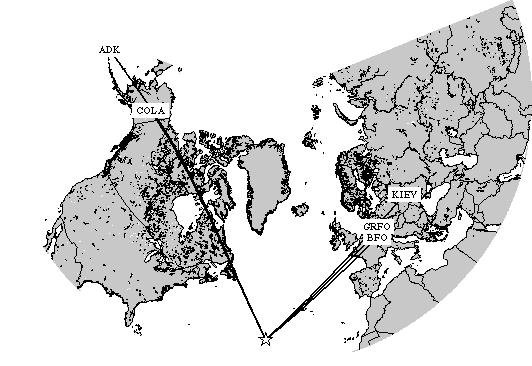
Figure 1. Map showing the location of an earthquake near the Mid Atlantic Ridge and ray paths to five stations, stations COLA and ADK in Alaska, stations BFO and GRFO in Germany, and station KIEV in the Ukraine.
Event Information
On October 5th, 2000 a moderately large event occurred near the Mid Atlantic
Ridge. It had a moment magnitude of 6.1 and occurred at 13:39:11.7 GMT. Its location was 31.73N
and -40.96E, the depth was approximately 10 km.
You will determine the Rayleigh wave group velocity curve for the path between GRFO and KIEV and from the earthquake at the Mid Atlantic Ridge to GRFO.
Group velocity curves
We have seen that wave packets travel with a speed that is called the group velocity, even though the individual peaks travel at a different velocity. You will measure the group velocity curve for two regions in the world, one for the path between station GRFO in Germany and station KIEV in the Ukraine and one for the path from the earthquake to GRFO.
In the following, you will let program SeisGram apply a Gaussian band-pass filter in the frequency domain, centered about a center frequency to isolate a wavepacket with frequencies close to the center frequency. You will estimate the arrival time of this packet by estimating the arrival time of the maximum amplitude of the packet. You then determine the group velocity for that center frequency by dividing the distance between the two stations by the difference in arrival time of the group at the two stations.
GRFO to KIEV
The distance between GRFO and KIEV is about 1278 km.

1. Click on the icon above to launch program Seisgram (you will have to do this for each
frequency). Click on 'Filter', then 'Gaussian' and enter a center frequency. You can leave
'alpha' at 10, it controls how wide the Gaussian frequency window is. Measure the arrival time of
the maximum of the wave packets (imagine an envelope around the signal and pick the arrival time as the time
at which the maximum arrives). Do this for both
seismograms, and for the center frequencies approximately evenly spaced between 0.01 and 0.05 Hz (e.g.
0.01, 0.015, 0.02, 0.025, 0.03, 0.04, 0.05 Hz). Try filtering a center frequency of 0.1 Hz, is it possible to determine
the arrival time of the group?
2. Make a graph of group velocity versus period (1/f).
Mid Atlantic Ridge to GRFO
3. Determine the group velocity between the event and station GRFO by
dividing the epicentral distance by the travel time. The epicentral distance is 4724 km.
4. Make a graph of group velocity versus period (1/f).