Step 4: Interpretation of the results

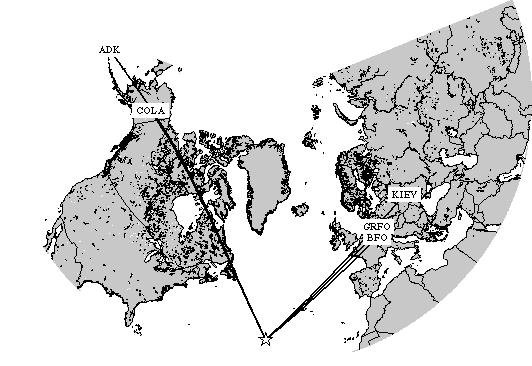
Figure 1. Map showing the location of an earthquake near the Mid Atlantic Ridge and ray paths to five stations, stations COLA and ADK in Alaska, stations BFO and GRFO in Germany, and station KIEV in the Ukraine.


Event Information

On October 5th, 2000 a moderately large event occurred near the Mid Atlantic Ridge. It had a moment magnitude of 6.1 and occurred at 13:39:11.7 GMT. Its location was 31.73N and -40.96E, the depth was approximately 10 km.


Interpretation of the phase and group velocity measurements.


5. Compare the phase velocity curve that you obtained for the path between BFO to GRFO to the group velocity curve for GRFO to KIEV.
Which of the two shows the highest velocities? Can you explain this?

6. Compare the group velocity curve for the path between GRFO and KIEV to the group velocity curve for the path between the Mid Atlantic Ridge and GRFO. Do you see the same trends that you would expect from the figure below?
Explain why the group velocity map for a period of 50 s shows predominantly blue colors for oceanic regions, whereas the continents are yellow or red. Note that the figures show (relative) deviations of the group velocity measurements relative to those predicted by an average Earth model.

7. Can you explain why these group velocity maps for 50s and 100s Rayleigh waves look so different from each other?

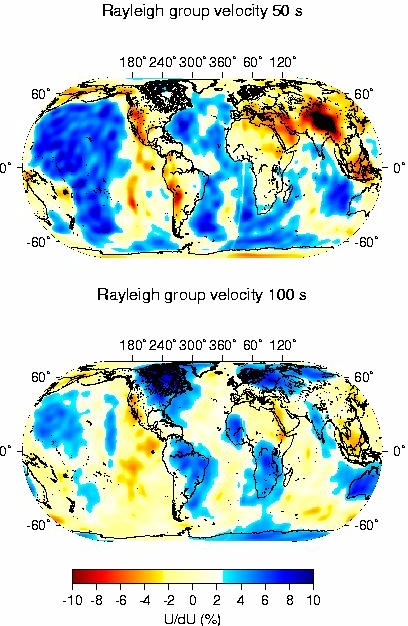
Figure 2. Group velocity maps for Rayleigh waves, top, period = 50s, bottom, period = 100s. These maps show percentage group velocity perturbation relative to Earth model PREM. From: Larson, E.W.F. and G. Ekström, Global Models of Surface Wave Group Velocity, Pure Appl. Geophys. 158 (8), 1377-1400, 2001.


home | lab 1. | lab 2. | lab 3.