Step 2: Measuring phase velocities
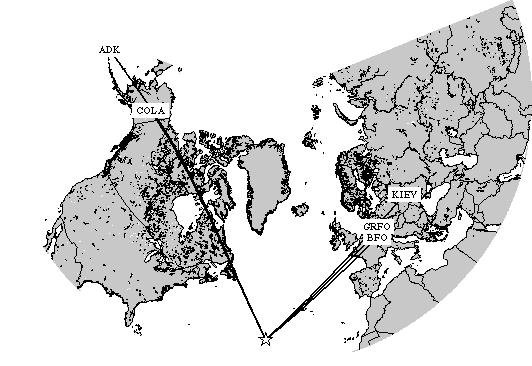
Figure 1. Map showing the location of an earthquake near the Mid Atlantic Ridge and ray paths to five stations, stations COLA and ADK in Alaska, stations BFO and GRFO in Germany, and station KIEV in the Ukraine.
Event Information
On October 5th, 2000 a moderately large event occurred near the Mid Atlantic
Ridge. It had a moment magnitude of 6.1 and occurred at 13:39:11.7 GMT. Its location was 31.73N
and -40.96E, the depth was approximately 10 km.
You will determine the Rayleigh wave phase velocity curve for the path between BFO and GRFO.
Phase velocity curve
BFO and GRFO lie at an azimuth of about 40 degrees from the earthquake and are only 224.4 km apart and the individual peaks in the seismogram at BFO (top panel
Figure 2) can be easily recognized at GRFO (bottom panel in Figure 2). Therefore, you are able to
follow each phase and should be able to determine the average phase velocity between the
two stations.
1. Obtain a rough estimate of the phase velocity curve that is appropriate for the region between BFO
and GRFO by determining the difference
in arrival time of each individual peak between the two stations.
Estimate the corresponding period by measuring the time difference between the
two neighboring peaks. Plot your measurements, i.e. phase velocity c against period T. (
reasonable estimates lie within 3.0 and 4.5 km/s).
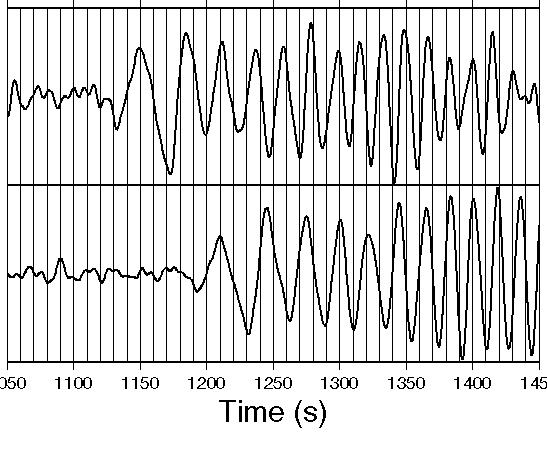
Figure 2. Top: Vertical component seismogram recorded at station BFO, bottom: vertical component seismogram at station GRFO