Step 2: The August 17, 1999 earthquake near Izmit, Turkey.
The epicenter of the August 17, 1999 Turkey earthquake was 40.748N 29.864E
according to the NEIC (the U.S. National Earthquake Information Center).
The depth of the earthquake was approximately 17 km.
In this section, you will determine the focal mechanism of this earthquake
by plotting the P-wave polarities of 11 seismograms of this earthquake
on a Wulff net or stereonet (using a stereographic projection).
Since we only use teleseismic observations (epicentral distances larger than 1000 km), all
rays traveled downward from the source.
Each polarity can therefore be plotted as a lower hemisphere projection at the appropriate
azimuth and take-off angle.
| Station | Vertical seismogram |
| ASCN |
|
| BTDF |
|
| COLA |
|
| FFC |
|
| HIA |
|
| KEV |
|
| KMBO |
|
| KONO |
|
| MAJO |
|
| PAB |
|
| TSUM |
|
Table 1. Input data of the August 17, 1999, Izmit earthquake in Turkey.
D = epicentral distance, f = azimuth
of the station, ih = take-off angle, Up/Down
designates the polarity of the P arrival (to be determined by you).
| Station | Lat (N) | Lon(E) | D(deg) | f(deg) | ih(deg) | Up/Down? |
| ASCN | -7.93 | -14.36 | 63.25 | 231 | 20 | |
| BTDF | 1.36 | 103.77 | 76.95 | 100 | 17 | |
| COLA | 64.87 | -147.85 | 74.70 | 359 | 18 | |
| FFC | 54.73 | -101.98 | 76.37 | 333 | 17 | |
| HIA | 49.27 | 119.74 | 60.50 | 49 | 21 | >|
| KEV | 69.76 | 27.01 | 29.11 | 358 | 28 | |
| KMBO | -1.13 | 37.25 | 42.22 | 169 | 25 | |
| KONO | 59.65 | 9.60 | 22.77 | 333 | 34 | |
| MAJO | 36.54 | 138.21 | 78.88 | 51 | 17 | |
| PAB | 39.55 | -4.35 | 26.09 | 279 | 28 | |
| TSUM | -19.20 | 17.58 | 60.73 | 193 | 21 |
4. Determine the polarities (compression/dilatation) of the P arrivals
of the seismograms.
(In order to read the polarity most accurately, use the sloping
triangles of the toolbar to change the vertical scale the seismograms.)
Use Table 1 to plot the polarities on the stereonet.
First mark the azimuth of the ray on the outer circle of the stereonet.
Then rotate this mark to the equator line and count the number of degrees of the take-off
angle from the center and mark the spot. If the
P wave of this observation is compressional, draw a small plus at the
location of the mark, otherwise draw a small circle. Use a pencil and work very neatly!
5. The observed polarizations should fall into four
different quadrants, separated by two planes that are orthogonal to each
other (i.e., the pole of one plane lies in the other plane).
Determine the strike, dip and rake of the two possible fault planes.
Also plot the P- and T-axes.
Figure 1. The general tectonic setting of Turkey. The small Turkish microplate is bounded on the east by the East Anatolian fault zone (EAFZ), on the north by the North Anatolian fault zone (NAFZ), on the west by a diffuse zone of deformation surrounding the greater Aegean region, and on the south by the Hellenic and Cyprus arcs. Earthquakes on the North Anatolian fault are caused by the northwards motion of the Arabian plate against the Eurasian plate, squeezing the small Turkish microplate westwards. Also, compression in this region is due to the northwards motion of the African plate, which produces subduction at the Cyprus and Hellenic arcs.
6.
Given the tectonic setting of Turkey illustrated in Figure 1, decide which of the
two possible
fault planes was the plane on which motion occurred during the earthquake near
Izmit. Motivate your choice.
See also:
Page 338 and 339 of the book by Stein & Wysession.
1999, Izmit, Turkey earthquake by USGS
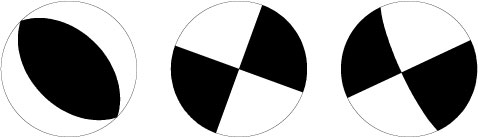
7.
The next figure shows the focal mechanisms of three other earthquakes that occurred in
and around Turkey.
Pick three likely locations for the three quakes, explain why you chose those three.