Picking travel times.

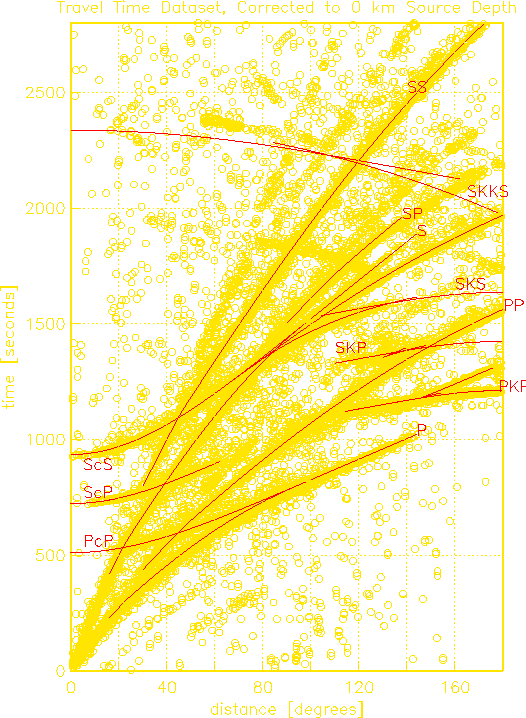
Figure. This plot shows only the associated arrivals, with all sources corrected to 0 km depth. The predicted travel time curves are from the IASPEI tables, for a source depth of 0 km. Note that the 'ghosting' visible preceding the P-arrivals could be due to a single uncataloged preshock. From: Albuquerque Seismological Laboratory Data Collection Center
How to obtain consistent and high-quality picks (of large volumes of seismograms) is still an active area of research in Seismology. Also check out the following site of the University of Washington. A group there is picking global P phases in order to improve the precision of P phase travel time curves.
top |
home |
next step |
lab 1. |
lab 2. |
lab 3. |
lab 4. |
lab 5.