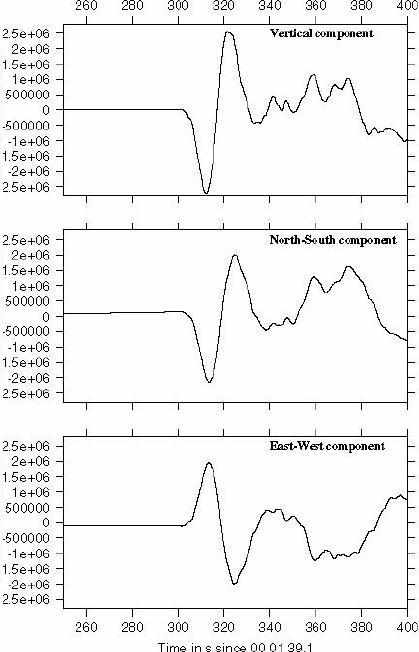
Figure 1. Three components of P wave displacement as recorded by station KONO in southern Norway.
Earthquake location
1. Why is it important to locate
earthquakes as accurately as possible?
Step 1: Single station approach.
Earthquakes generate seismic waves that propagate
through the Earth and that are recorded by seismic instruments all
over the world.
The relative amplitudes of the three components of ground
displacement due to a P wave arrival at a single station can be
used to get a rough idea of where the signal is coming from (and
therefore, in which direction the earthquake occurred).
The difference in arrival time between the P and the S wave can be
used to estimate the distance to the earthquake.
Use the recordings of vertical and horizontal ground displacements
(in nanometers) of a large earthquake recorded by station KONO in
southern Norway and combine the directional information with the
distance information to get a rough estimate of this earthquake's
location.
Figure 1. Three components of P wave displacement as
recorded by station KONO in southern Norway.
2. Measure the amplitude of the P phase on
the North-South component (North is positive) and on the East-West
component (East is positive) from the records shown in Figure 1.
a. Plot these components in a coordinate system with the
N-S direction as the y-axis and E-W the x-axis.
b. Determine from which direction the P wave arrived. Note
that 'Up' is positive on the vertical component.
SeisGram2K mini-manual

Figure 2. To launch the Java program Seisgram2K.
3. For a teleseismic event (an earthquake
that is very far away from the station where the seismogram is
recorded), the P phase is visible most prominently on the vertical
component, whereas the S phase is the first large arrival on the
horizontal components.
a. Explain why this is the case and check that this also
the case for the seismograms in figure 2.
b. Measure the arrival time difference between the P and
the S. You may have to zoom in to pick times accurately.
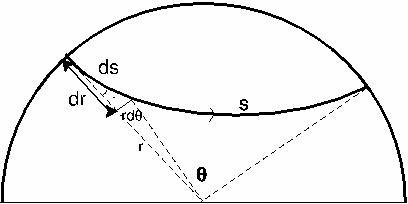
Figure 3. Q = angular epicentral distance
4. Seismologists often talk about
epicentral distances in degrees, instead of kilometers. Figure 3
shows a cross-section through the earth along the plane of a
seismic ray. It shows how the epicentral distance can be defined
by an angle. How many kilometers along the surface correspond to
one degree in epicentral distance? (The radius of the earth is
approximately 6371 km.)
5. Compare the value of the S-P time that you found to the
graph in Figure 4 and determine the approximate distance to the
earthquake in km.
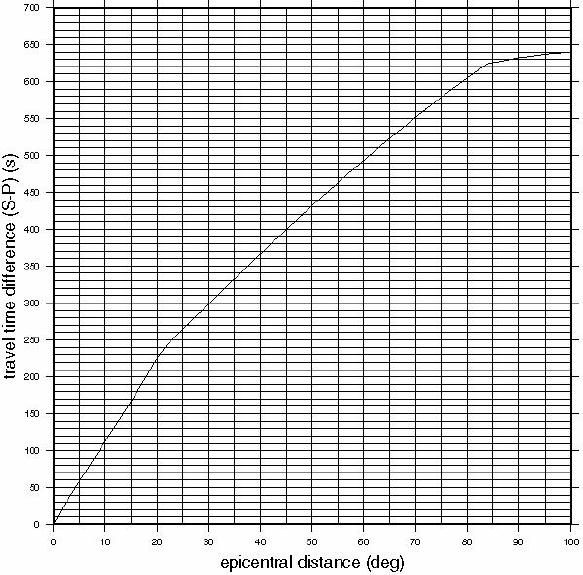
Figure 4. Travel time difference between P and S as
a function of epicentral distance. The values were calculated
assuming an earthquake at the surface and 1-D reference Earth
model ak135.
6. Use Figure 5 and the information from 2. and 5. to determine the approximate coordinates (latitude and longitude) of the earthquake.
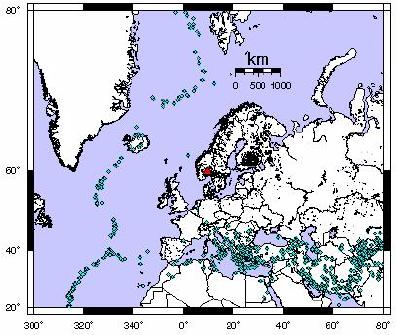
Figure 5. Map centered on station KONO in southern
Norway (red triangle). Blue dots show locations of large
earthquakes that occurred during the period 1976 to 1993. Angles
and distance can be highly distorted due to the map projection.