All slices must be perfect
Harmen Bijwaard
Slices from bar codes
The Earth's radius is about 6400 km. The deepest boreholes, however, do not even penetrate
into the lower crust, but only go some 12 km deep. All knowledge about what happens below this
depth: in the mantle and core of the Earth, has been derived from circumstantial evidence.
Apart from geological, gravitational, magnetic and thermal data, this evidence consists
primarily of seismological data, i.e. seismograms that registrate the motion of the Earth's
surface after an earthquake, an explosion or a landslide.
A seismogram is a sort of bar code: the different parts of the code tell you something about
what is inside. Seismic tomography, the subject of this story, tries to unravel part of the
code. The method has been copied from the so-called CT-scan that is used in hospitals to make
"cross-sections" through the human body. The word "tomography" litterally means "drawing
slices", in this case slices of the Earth.
Principiae Tomograficae
The layered structure of the Earth's interior has been known quite accurately since the 1950s.
Through the combination of the travel times of different seismic waves the so-called Jeffreys
and Bullen model was derived, which describes how the velocities with wich longitudinal (P)
waves and transverse (S) waves travel through the Earth, vary with depth. These velocities
are directly linked to density and other material parameters that themselves depend on
temperature, pressure, and composition of the Earth's interior.
However, if the physical parameters that determine the seismic velocities would only vary
with depth, our planet would be a very dull place: no mountains would be formed, there would
be no active volcanism, and there would not be any earthquakes. It is the lateral variations in
temperature, pressure, and composition (and thus P and S velocities) that cause the motion of
the plates that form the Earth's surface. Seismic tomography helps us map these lateral
variations in wavespeeds. The principle is illustrated in the cartoons in Figures 1a and 1b.
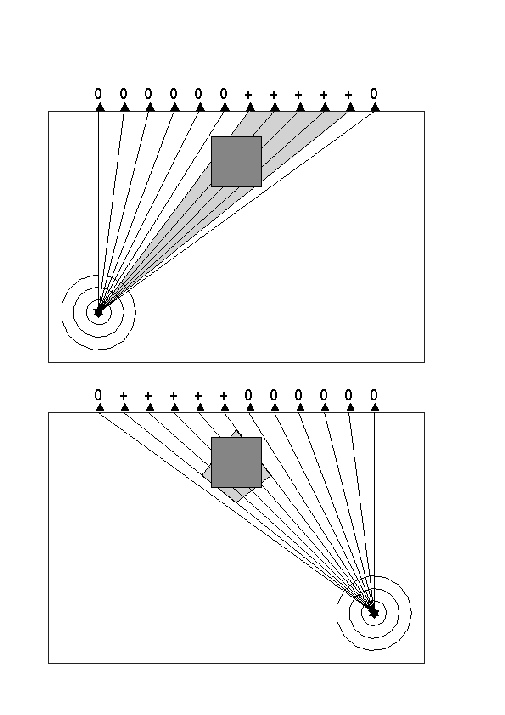 Figures 1a and 1b
Suppose an earthquake takes place at a certain depth (the star in Figure 1a). A more or less
spherical wavefront will then develop that can be observed when it reaches the seismic stations
(triangles) at the surface. Between the source and receivers 7 till 11 there is some structure
with a relatively low seismic velocity (an anomaly that is depicted by the square). These
stations measure a late arrival of seismic energy (their residual is +); All other stations
measure the standard travel time (their residual is 0). An ignorant outsider can deduce from
these data (by inversion) that there has to be an anomaly somewhere in the gray area. When
a second earthquake then occurs at a different location (see Figure 1b), it will give a different
illumination of the anomaly and residuals will be measured at receivers 2 till 6. The area
which should contain the anomaly is then decreased to the gray quadrangle in Figure 1b. Clearly,
we can repeat this procedure for every new earthquake and in this way we can obtain even more
accurate images.
The real world
Unfortunately, the reality is more complicated. The exact location and origin time of an
earthquake are generally not known and have to be determined from the same seismological
data (we have a coupled problem). Furthermore, the paths along which the seismic energy travels
will bend, refract and reflect at the anomaly (the anomaly influences the travel times not only
directly but also indirectly: non-linearity). Besides that problems may arise due to the
fact that an earthquake is not a point source, the Earth is generally slightly anisotropic and
anelastic, and waves do not really travel along infinitely thin paths (Fresnelzones). Apart
from these theoretical problems there are also practical problems. Huge amounts of data are
needed to construct a reasonably detailed model and these data are very heterogeneously spread
throughout the Earth. Most seismic stations reside on the continents and primarily in the
northern hemisphere which leads to a very poor sampling of large parts of the Earth.
Furthermore, seismological data contain quite a lot of noise and misinterpretations of the
arrivals of different waves.
In order to minimize the consequences of the problems, a number of assumptions is made.
First of all, the bending of the travelled path due to anomalies and any anisotropy and
anelasticity is generally neglected. This is not a gross simplification, because anomalies
usually have amplitudes of only a few percent and anisotropy and anelasticity are estimated
to be of very minor importance. Apart from that, only the most reliable waves (the first
arrivals) are used and these are often grouped together in bundles to reduce the number of
data. Since all data contain errors, usually the least squares approximation is used. The
inverse problem is translated into a matrix-vector equation, the least squares equivalent of
which is being inverted with an approximative and iterative method (the matrix is despite all
"liposuction" still far too large for direct inversion). The results that are shown here
(Figures 2 till 4), have been constructed with a minimum number of unknowns in the inverse
problem. Usually a model volume is divided in similar cells and for each cell the seismic
velocity is then determined. However, since the data sampling of the model space is so uneven,
it is more sensible to put small cells where there are many data and large cells where there
are few. In practice our cells have been chosen in such a way that they contain approximately
the same number of paths. An important advantage of this method is that especially in subduction
zones where most earthquakes occur, very small cells can be used that described their structure
after inversion in great detail. To give an impression of the computer that is needed to make
these calculations: For the global tomography model up to 2800 km depth (the core-mantle
boundary) from which the slices in Figures 2 till 4 have been taken, 7.6 million data have been
used (from 1964 till now), grouped together in 4.5 million bundles to solve for 450,000
unknowns (280,000 cells plus 4 unknowns per earthquake). A single inversion takes about 3 days
on a so-called R8000 processor.
A journey to the centre ...
Figures 2 till 4 are cross-sections through some tectonically interesting areas. Blue colours
depict relatively high seismic wavespeeds that can be associated with relatively cold plate
material. Figure 2 shows the Earth's structure at 200 km depth below Southeast Asia: Clearly
visible are the many subduction zones where cold oceanic plates dive into the mantle, like
below the Sunda and Banda arc, New Guinea, Sulawesi, the Philippines, Taiwan, Japan and in the
Marianas trench. The subduction zones are not straight lineaments, but usually consists of
several arc shaped segments. Near Sulawesi there are 2 subduction zones next to each other:
In the western one material subducts in northwesterly direction and in the eastern one in
southeasterly direction.
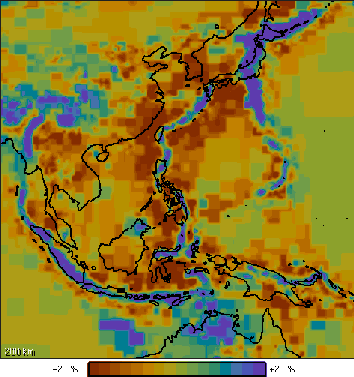 Figure 2
Figure 3 is a cross-section through the Indian Ocean, approximately along the border between
India and Pakistan, through China and a few former Sovjet republics. The map shows the
precise location of the cross-section and the locations of earthquakes. In the upper 300 km
we see the thick, cold continental material of the Indian plate and the slightly thinner
Eurasian continent with in between (between kilometer tags 3000 and 4000) an elaborate
wrinkling zone. There seems to be no material going down (continental material is hard to
subduct), but at about 1400 km depth there is a large, vague high velocity anomaly that is
being interpreted as the completely disappeared Tethys Ocean plate that once lay between
Africa/India and Eurasia.
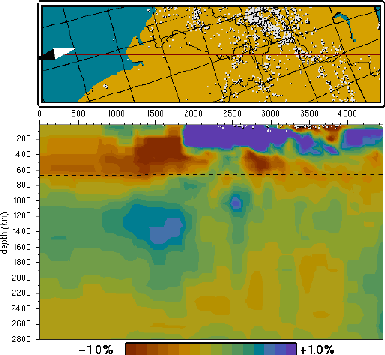 Figure 3
Finally, in Figure 4 we can observe an active subduction zone. This is a cross-section through
China and the seismically active Kuriles. The seismicity exactly follows the subducting Pacific
Ocean plate until about 500 km depth where the plate appears to lie flat. From the layered
Earth structure it is known that a jump in seismic velocity occurs at 660 km depth. That jump
is presumably caused by a phase transition at which upper mantle material transforms to a
denser structure. It has long been uncertain what exactly happens to plate material at that
depth: Is it possible for a plate to penetrate through the phase transition and sink into the
lower mantle or will it get stuck above it? Although the cross-section becomes less accurate
below 660 km depth, the plate material seems to have broken through the discontinuity and has
been sinking to the core-mantle boundary (2800 km).
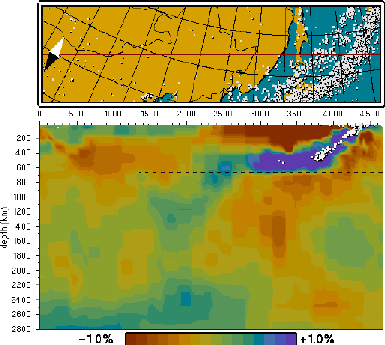 Figure 4
Epilogue
How reliable are these Figures? It is impossible to calculate a formal resolution matrix for such
a huge inverse problem. In order to find out how reliable and accurate the calculated
solution actually is, synthetic models are used that consist of fake anomalies. For such a
synthetic model travel times and residuals are calculated belonging to the geometry of the
real data. Noise is added to these fake data and they are inverted in the same way as the real
data. From the comparison of the result with the original synthetic model it is possible to
deduce an estimate of the resolving power of the real model. Despite the relatively poor fit
of the bulk of the data (the maximum variance reduction in tomographic inversions is about
50%), the results seem to be pretty accurate on a scale of 100 km in areas with substantial
sampling. One can thus not believe every detail, especially not for larger depths where the
signal gets weak and the error relatively large, but the large-scale structure remains
unchallenged.